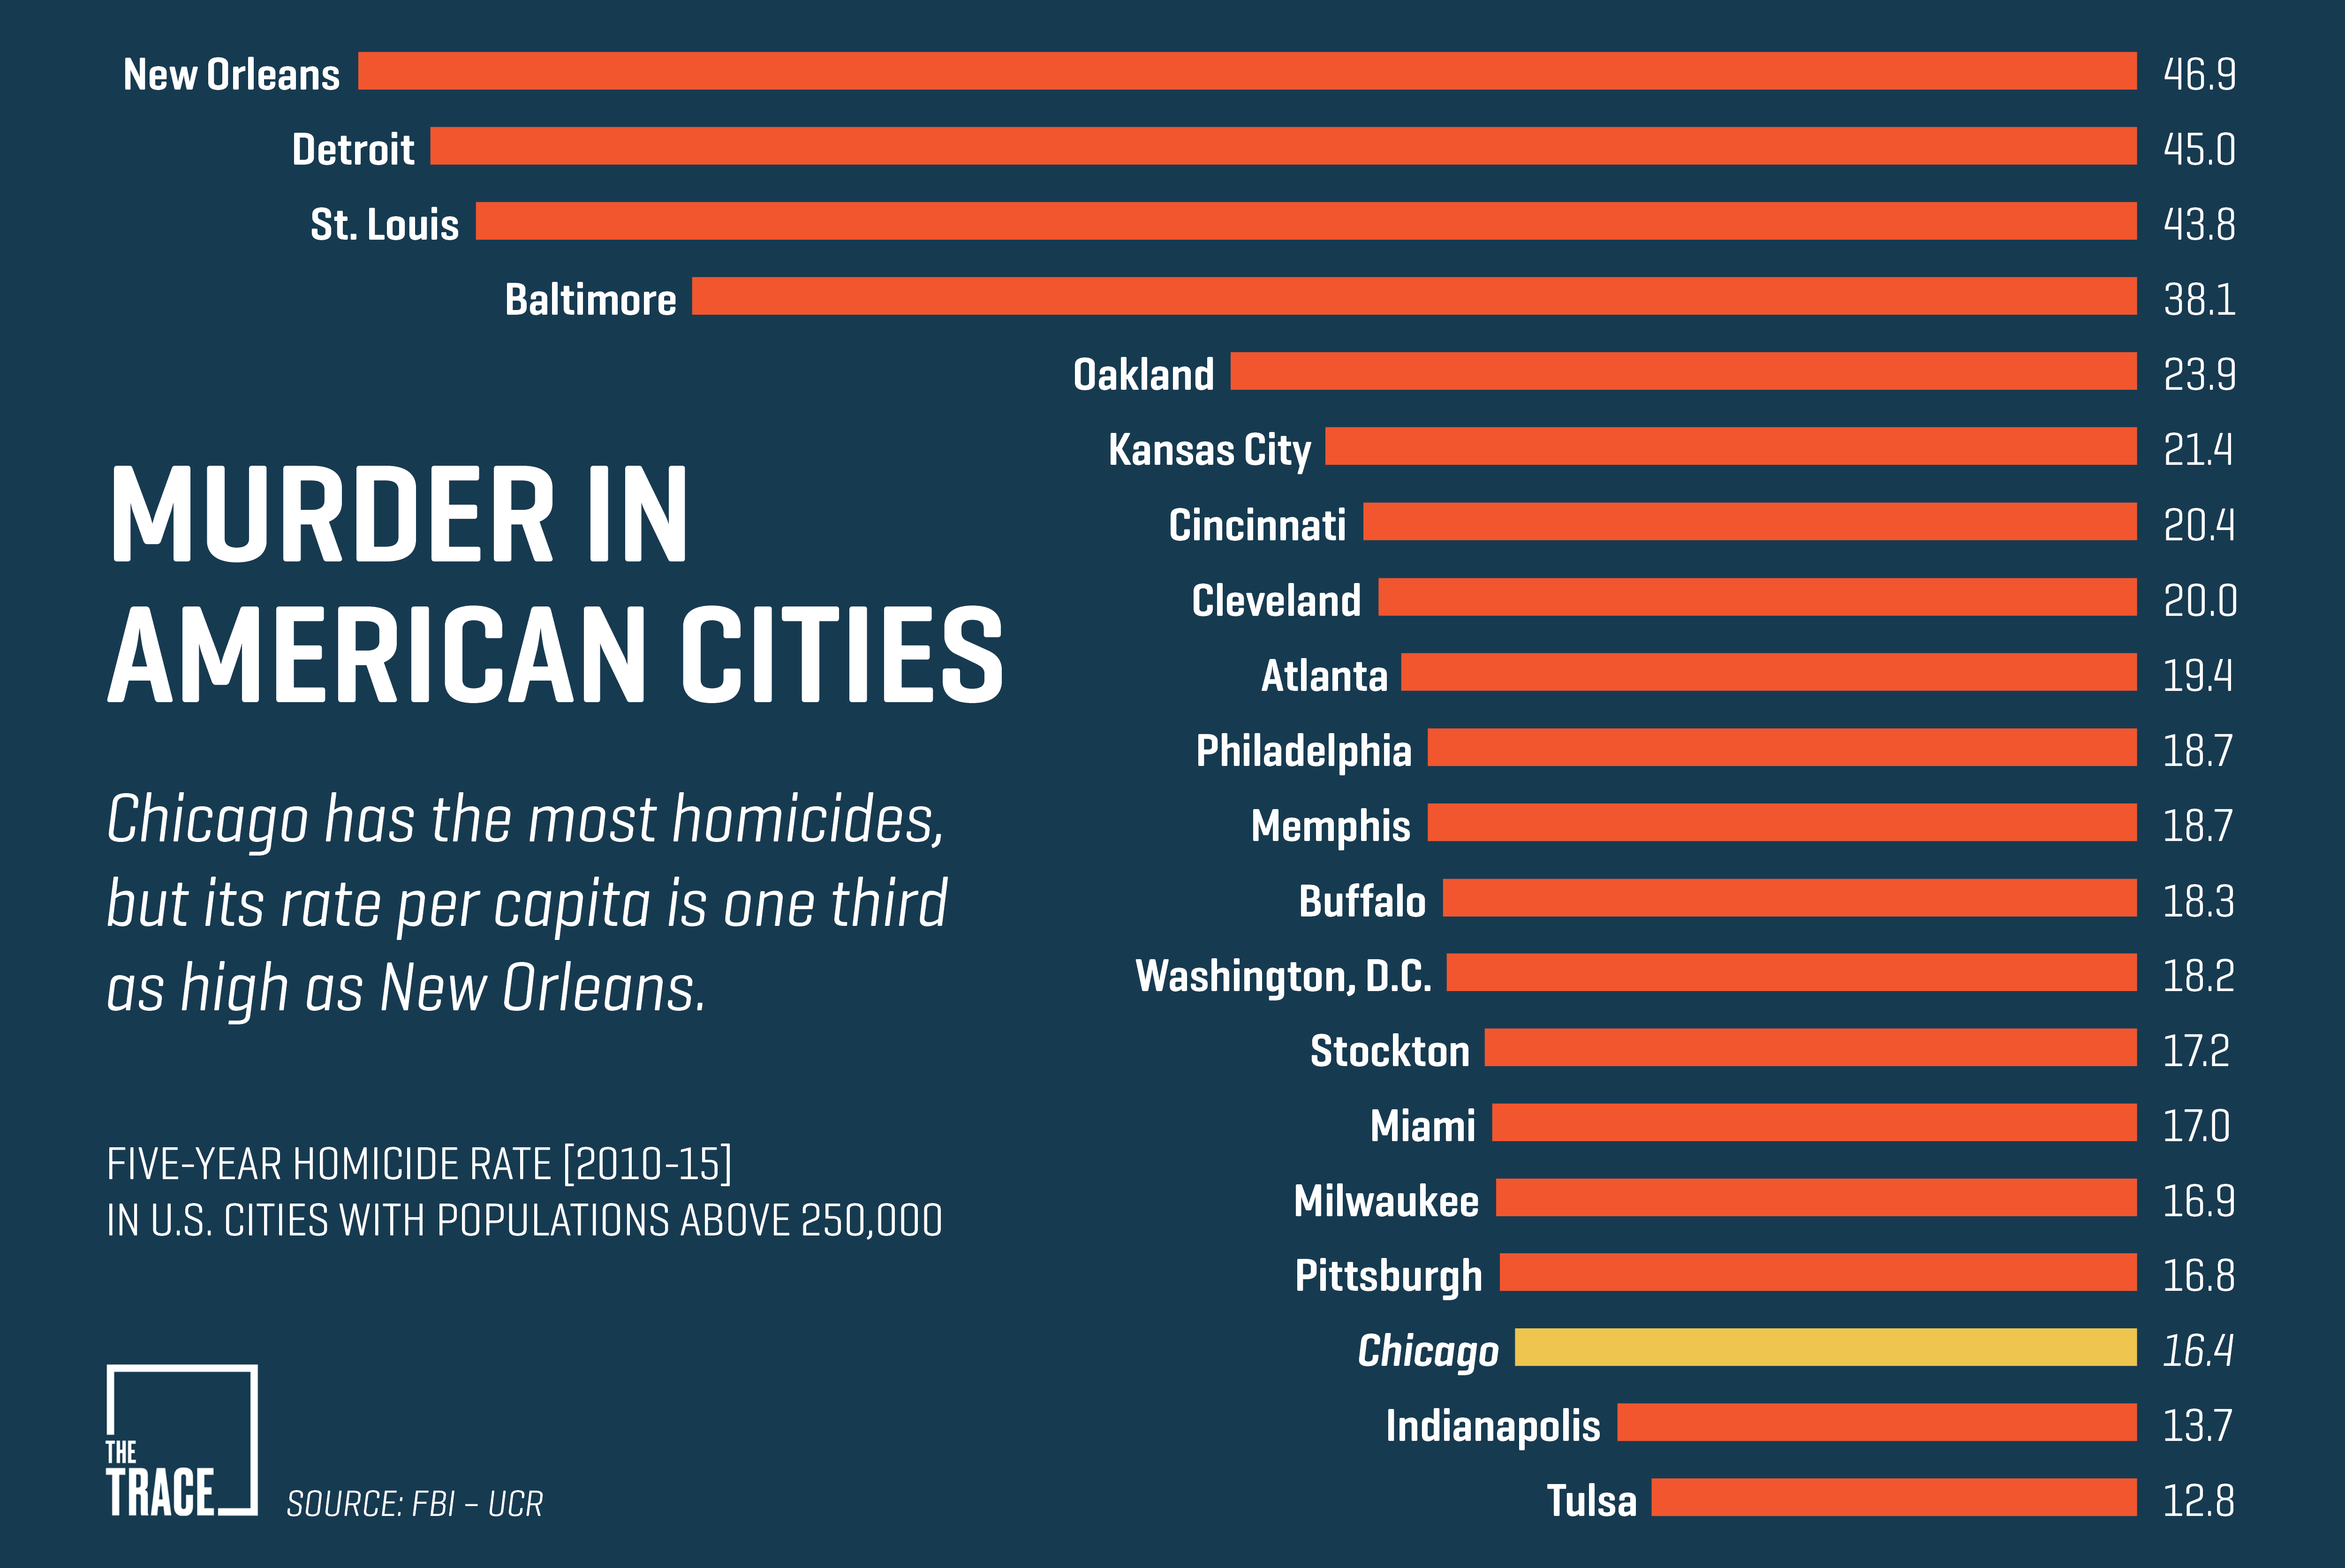
Interesting graph. I'm thinking if you made another that showed murders per capita of diversity the graph would be a straight line. Include cities in other continents just for giggles.
I didn't make the first graph, but back in the mid-1990s, when they cared about honesty, National Review noted that if we looked at crime in America committed by caucasians, our crime rate is lower per capita than Switzerland; and that if you screened out Hispanic crime from caucasian crime, our national crime rate per capita is lower than that of Lichtenstein (Google it if you need to).
@loren Well now, that thought of yours would be badthink. That said, I may know of someone who actually made the plot and ran basic statistics.
METHODS Now, this person may have used demographic information from the 2010 US Census, and s/he may have used simple Pearson correlation to examine the association between the aggregate 2010-2015 homicide rate (from the figure) and the following: 1. percent population black/African-American (%B) 2. percent white (%W; ignoring the "non-Hispanic" thing, i.e. regardless of n-H or H you were just plain white -- except for Miami, where the n-H white figure was used) 3. percent non-white (%NW=100% - percent white) 4. out of curiosity, homicide rate vs total city population (because of the whole "mouse utopia" thing -- those of you who don't know what that is, LOOK IT UP) Anyway, this badthinking person may also have tested the significance of the correlation.
RESULTS It's rumored that the results are as follows (HR=homicide rate, %B, %W, %NW as above; TP=total population) HR vs %B: r=0.68, p<0.001 HR vs %W: r=-0.46, p<0.05 [note the negative sign] HR vs %NW: r=0.46, p<0.05 [this is a well, duh finding since %NW is 100%-%W, but presented for completeness] HR vs TP: r=-0.16, p=nonsignificant
--continued-- DISCUSSION So the association between percentage of blacks in the population is significantly correlated (the p<0.001 indicates that there is less than a 1 in 1000 chance this is a spurious finding due to random chance rather than a true association) with homicide rate. Note that the percentage of whites and HR is inversely correlated (hence the negative sign on the "r" value); higher proportion of whites is associated with lower homicide rates. More non-whites is associated with more homicide, but the association is weaker than the association between blacks and homicide.
Note that the r=0.68 for %B vs HR gives an r2 (r-squared) of 0.47. Despite lazy stats jargon commonly in use, this does NOT mean that blackness "explains" 47% of the homicide rate. The r2 is a way of assessing how well the underlying statistical model (i.e. the badthinker assumed a straight-line relationship between %B and HR when s/he used linear correlation) fits the actual data. An r2=1.0 (maximum possible value) would indicate that a linear model perfectly fit the data. Which it doesn't. What this says is that there is a linear relationship between %B and HR, but the fit is only "okay" and not "good" much less perfect.
To expand on the above, even though these results show a significant linear association between %B and HR, it doesn't tell us about causation. For example, it could be that poverty is the cause of high HR, and blacks tend to be economically disadvantaged.
There are many limitations to this simple analysis, including the fact that the HR is averaged over 2010-2015 and does not fully capture recent spikes in homicide rates (q.v. Baltimore [AKA (c)Harm City, hat tip to James LaFond] since the Freddie Gray unfortunateness). Also, these findings are not adjusted for other factors such as income, education, differences in police staffing and ROES, etc. Finally, these results are unlikely to generalize to other nations.
So says this badthinking person I'm sure I don't know well at all. Certainly not a friend of mine. -------------- A last note from me. Wikipedia has an entry on 50 cities (not a war zone, population>300k) worldwide with the highest homicide rates. Four US cities are on this list (St Louis at #14, Baltimore #26, New Orleans #34, Detroit #36). The list is dominated by Central and South American cities (especially Brazil); Africa is represented only by Cape Town (#13), Nelson Mandela Bay #43 and Durban #50. Two thoughts on this: 1. I am astonished to see not a single European* or Asian city on the list; 2. Only the RSA represents Africa on the list. This may be because the rest of Africa is safer, homicide-wise, than the RSA and the USA, or it may be because in much of Africa they are so screwed up that they aren't able to keep records of homicides. The reader is invited to decide him/herself.
*that may mean this is a shitty and incomplete wikipedia article; also, things are just beginning to hot up as more and more culture enrichment takes place
Regarding African "statistics", as such, refer to my Ebola posts from 2014 onwards. Getting stats from people who lie about them because they can (let alone must), and due to literacy and numeracy rates need their shoes off to get to twenty (assuming they possess both legs) bodes a poor source sample to work with.
Google Kim DuToit's old essay "Let Africa Sink", and work forward from that point.
Regarding Asia: Singapore, Seoul, Tokyo, and even Peking are one thing. Bangkok, Djakarta, Manila, and Mumbai probably something else entirely.
In my experience, most large cities resemble most closely Pratchett's fictional Ankh-Morpork in any terms, but particularly crime, more than the city fathers of such districts would like to admit (and will deny, when the point is pressed).
So at that point, is a city better served by someone who thinks people are basically bad, and government is a guard rail on unchecked behavior, and neutral towards those staying in their lanes; or by one which thinks people are basically good, apologizes for the worst by blaming nurture over nature, gives them 27 chances to prove it, and seeks to force them all to be better, whether they like it or not, and nannies them 24/7/365?
Not counting the news outlets or websites along the full range of accuracy and veracity, I follow multiple actual individuals' handwritten blogs. (Bot news aggregators don't thrill me.) Looking them over, many are current serving or former military and a couple are some variation of high-speed low-drag elite forces ninjas. Or just funny as all. Because life without humor is just despair. So in other words, the same folks I trusted in the military not to wet the bed, sh*t themselves, or otherwise run around like headless Nancys, are the same folks I trust on the interwebz, for demonstrating pretty much the same trustworthiness and circumspectly responsible behavior. Color me shocked.
Comments are fully moderated, due to idiots and trolls. Grown up discussion here will appear just as soon as I have the time to push it through. ANONYMOUS UNSIGNED COMMENTS WILL BE AUTO-DELETED WITHOUT MERCY, and the url added to the spam filter, or mercilessly mocked at the bloghost's sole discretion. If you're too chickensh*t to come up with an alias for online purposes, you're not tall enough for this blog. Pick a name, and stick with it, and you're good. Get cute, and you're wasting your time and my electrons, and your masterpiece will never see the light of day. No warning shots will be fired. If you can't maintain decorum and polite behavior, I won't toy with you, I'll squash you. If one of your comments disappears, YOU f**ked up. If all of them do, it's time for you to go. Disagree with the points made, on the merits, and you're good. Go after me personally, or other commenters, and your comment will never see daylight here. My tolerance for skirting the line is at absolute zero, and will remain there. Don't f**k up.


7 comments:
The Democrats keep talking about common-sense gun laws we can all agree on. I have one: No guns for Democrats!
http://www.teachyourselftoshootbetter.com/blog/common-sense-gun-laws-can-agree-no-guns-democrats/
Interesting graph. I'm thinking if you made another that showed murders per capita of diversity the graph would be a straight line. Include cities in other continents just for giggles.
I didn't make the first graph, but back in the mid-1990s, when they cared about honesty, National Review noted that if we looked at crime in America committed by caucasians, our crime rate is lower per capita than Switzerland; and that if you screened out Hispanic crime from caucasian crime, our national crime rate per capita is lower than that of Lichtenstein (Google it if you need to).
I doubt that was true only then.
@loren
Well now, that thought of yours would be badthink. That said, I may know of someone who actually made the plot and ran basic statistics.
METHODS
Now, this person may have used demographic information from the 2010 US Census, and s/he may have used simple Pearson correlation to examine the association between the aggregate 2010-2015 homicide rate (from the figure) and the following:
1. percent population black/African-American (%B)
2. percent white (%W; ignoring the "non-Hispanic" thing, i.e. regardless of n-H or H you were just plain white -- except for Miami, where the n-H white figure was used)
3. percent non-white (%NW=100% - percent white)
4. out of curiosity, homicide rate vs total city population (because of the whole "mouse utopia" thing -- those of you who don't know what that is, LOOK IT UP)
Anyway, this badthinking person may also have tested the significance of the correlation.
RESULTS
It's rumored that the results are as follows (HR=homicide rate, %B, %W, %NW as above; TP=total population)
HR vs %B: r=0.68, p<0.001
HR vs %W: r=-0.46, p<0.05 [note the negative sign]
HR vs %NW: r=0.46, p<0.05 [this is a well, duh finding since %NW is 100%-%W, but presented for completeness]
HR vs TP: r=-0.16, p=nonsignificant
--continued--
DISCUSSION
So the association between percentage of blacks in the population is significantly correlated (the p<0.001 indicates that there is less than a 1 in 1000 chance this is a spurious finding due to random chance rather than a true association) with homicide rate. Note that the percentage of whites and HR is inversely correlated (hence the negative sign on the "r" value); higher proportion of whites is associated with lower homicide rates. More non-whites is associated with more homicide, but the association is weaker than the association between blacks and homicide.
Note that the r=0.68 for %B vs HR gives an r2 (r-squared) of 0.47. Despite lazy stats jargon commonly in use, this does NOT mean that blackness "explains" 47% of the homicide rate. The r2 is a way of assessing how well the underlying statistical model (i.e. the badthinker assumed a straight-line relationship between %B and HR when s/he used linear correlation) fits the actual data. An r2=1.0 (maximum possible value) would indicate that a linear model perfectly fit the data. Which it doesn't. What this says is that there is a linear relationship between %B and HR, but the fit is only "okay" and not "good" much less perfect.
To expand on the above, even though these results show a significant linear association between %B and HR, it doesn't tell us about causation. For example, it could be that poverty is the cause of high HR, and blacks tend to be economically disadvantaged.
There are many limitations to this simple analysis, including the fact that the HR is averaged over 2010-2015 and does not fully capture recent spikes in homicide rates (q.v. Baltimore [AKA (c)Harm City, hat tip to James LaFond] since the Freddie Gray unfortunateness). Also, these findings are not adjusted for other factors such as income, education, differences in police staffing and ROES, etc. Finally, these results are unlikely to generalize to other nations.
So says this badthinking person I'm sure I don't know well at all. Certainly not a friend of mine.
--------------
A last note from me. Wikipedia has an entry on 50 cities (not a war zone, population>300k) worldwide with the highest homicide rates. Four US cities are on this list (St Louis at #14, Baltimore #26, New Orleans #34, Detroit #36). The list is dominated by Central and South American cities (especially Brazil); Africa is represented only by Cape Town (#13), Nelson Mandela Bay #43 and Durban #50. Two thoughts on this:
1. I am astonished to see not a single European* or Asian city on the list;
2. Only the RSA represents Africa on the list. This may be because the rest of Africa is safer, homicide-wise, than the RSA and the USA, or it may be because in much of Africa they are so screwed up that they aren't able to keep records of homicides. The reader is invited to decide him/herself.
*that may mean this is a shitty and incomplete wikipedia article; also, things are just beginning to hot up as more and more culture enrichment takes place
Regarding African "statistics", as such, refer to my Ebola posts from 2014 onwards.
Getting stats from people who lie about them because they can (let alone must), and due to literacy and numeracy rates need their shoes off to get to twenty (assuming they possess both legs) bodes a poor source sample to work with.
Google Kim DuToit's old essay "Let Africa Sink", and work forward from that point.
Regarding Asia: Singapore, Seoul, Tokyo, and even Peking are one thing.
Bangkok, Djakarta, Manila, and Mumbai probably something else entirely.
In my experience, most large cities resemble most closely Pratchett's fictional Ankh-Morpork in any terms, but particularly crime, more than the city fathers of such districts would like to admit (and will deny, when the point is pressed).
So at that point, is a city better served by someone who thinks people are basically bad, and government is a guard rail on unchecked behavior, and neutral towards those staying in their lanes; or by one which thinks people are basically good, apologizes for the worst by blaming nurture over nature, gives them 27 chances to prove it, and seeks to force them all to be better, whether they like it or not, and nannies them 24/7/365?
The posted graph speaks volumes to that question.
Here's an article from one of the W4 posts. Goes right along with this.
https://gunculture2point0.wordpress.com/2017/05/27/the-problem-with-averages-in-understanding-guns-violence-and-crime-take-3/
BAP45
Post a Comment